Hello everyone. Last time, I wrote about “Conjoint Analysis” which was introduced as one of the analysis methods when conducting primary research. I wrote that Conjoint Analysis is called as “Design of Experiments in the marketing field”, but this time I would like to write about that “Design of Experiments”.
1. What is “Design of Experiments”?
Design of Experiments is a method originally used in the field of quality control, so I think it is not well known among problem solvers. However, quality control is almost synonymous with “Six Sigma“, and in the Six Sigma methodology, this Design of Experiments is one of the core elements. Therefore, I think that many people who have experienced Lean Six Sigma are familiar with it.
However, this is confusing 🙂 Six Sigma in general is difficult to understand, but this experimental design method is also difficult. I think that there are probably few people who understand this correctly and use it according to theory. If you try to do it in theory, it will be difficult, so in this blog, I will focus on practical points.
2. How to use and view “Design of Experiments”
Design of Experiments is a method similar to “Conjoint Analysis” as I wrote at the beginning. Last time, I wrote that the process of conjoint analysis is roughly divided into the “survey design” stage and the “analysis” stage.
Similarly, if we divide Design of Experiments into the “survey design” stage and the “analysis” stage, the point of the survey design stage is “orthogonal table”, and the point of the analysis stage is “analysis of variance”.
1) The point of the survey design stage – Orthogonal table
This is exactly the same as conjoint analysis, so please take a look at my previous post.
As I wrote last time, when assigning orthogonal table, the concept of “Latin square” and “interaction effects” comes up. This part is important from an academic point of view, and a considerable amount of explanation is devoted to it. The interaction effects is, this is a repeat of the previous article, but in this orthogonal table layout image, that there is a combination effect of “weight x battery life”, not just “weight” and “battery life”.

However, in practice, it is unlikely that the interaction effects will become large, so I think that it can be put aside for the time being. Latin square is important when performing orthogonal table layout considering interactions effects, but let’s put them aside to be practical.
2. The points of the analysis stage – ANOVA (Analysis of Variances)
Since it is called “Analysis of variances”, it is often misunderstood that it is a method to analyze variances. But this is actually a method to identify if there are statistically significant variances among the average of multiple datasets.
As for the actual analysis, one way is to compare the average value of each level for each attribute like this (using the data in Fig1).

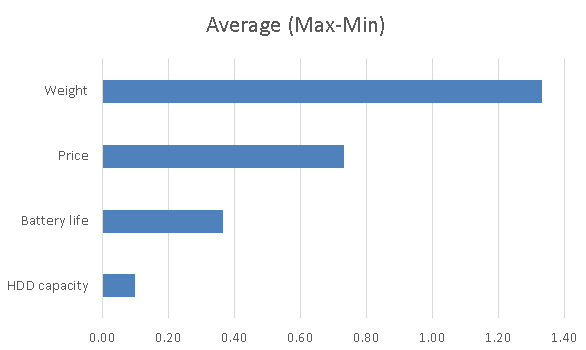
You can also look at the difference between the level with the max value and the level with the min value for each attribute.

This is similar to the graph that came out in the previous conjoint analysis post. The difference is that the value of conjoint analysis is the result of multiple regression analysis, while this is the difference of the average.
The next step is to use ANOVA to find out if the above difference of average is statistically significant. ANOVA also has the “P value” that came out in the multiple regression analysis. The view is the same as multiple regression analysis, so we look at “whether the P value is less than 5%”. ANOVA can also be done using Excel. There are a lot of specific ways to proceed with the analysis on the Internet, so let me post one link.
3. Differences between Design of Experiments and Conjoint Analysis
As we have seen so far, the parts that use orthogonal tables are the same for both methods, and the difference is the analysis method.
Personally, I prefer conjoint analysis using multiple regression analysis to design of experiments that only compares the difference in averages (although ANOVA checks whether the differences are statistically significant), because conjoint analysis can measure the impacts of independent variables on outcome variable. Of course, I think there are various opinions here, and I think there are factors such as ease of use and familiarity. Statistics is “practice makes perfect”, so please try various things.
That’s all for this time, and I would like to continue from the next time onwards. Thank you for reading until the end.